


I bet that not once you happened to find yourself in the situation of requiring a great product that will help you come up with wonderful charts. A great solution for this issue could stand in the shape of FusionCharts – a program that is ready to assist its users who work in sales, marketing, inventory departments, and so on. So, if you are willing to use javascript/html5 charts, then you should definitely learn more about this product.

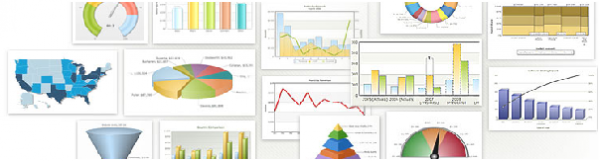
First of all, let’s talk about the chart gallery. If you will check this area out, you will find out that this product is the best, precisely because it is made up of four programs: FusionCharts XT, FusionWidgets XT, PowerCharts XT and FusionMaps XT. All these programs come with unique features that will help you complete whatever task you may have.
As far as money is concerned you should know that there are various options. For instance, you could go for the download trial, in which you will benefit from all the packages that were mentioned above or from individual products. If you would like to purchase the product, after the trial period, then you could either go for a corporate license or for a personal use one.
Now that you are aware of the fact that it is possible to download the free trial first, let’s talk about product info, as well. The beauty of these jQuery charts lies in the fact that they can be used beautifully on personal computers, Android devices, iPhones, Macs, and so on. Also, it brings rich interactivity through its great tooltips, one click chart export and print or easy zooming and scrolling.
Not to mention that this will help you make correct business decisions thanks to its javascript charting library, which includes over 90 chart types. Oh, and one should really take into consideration the fact that creating a chart is extremely simple and it could take you less than 15 minutes, if you will follow the steps mentioned on their website. Anyway, this product has many more features that could ease your activities and that could help you overcome all the difficulties that could appear at work.
In case you desire a few helpful tips and tricks on how to create your chart or if you are curious to see real life scenarios with the power packed reporting experience, then you should have a look at their business demos. This way, you will get inspired and you will find it easier to come up with the right chart.
In the end, you should definitely choose this product for your charts because this could help you save time, this will bring some modernity in your life and also this is equipped with many great features. And last but not least, do have a look at the comparison table they have designed especially for you, so that you will be able to see the differences between various JavaScript/HTML5 charting libraries in the market. Just go to this address www.fusioncharts.com/javascript-charting-comparison/ and you will be able to make up your mind. This way, your job will become a lot easier and it goes without saying that you will be much happier.


It is really amazing and informative java script charts thanks for sharing such a good information with us.