Information graphics or infographics as it is generally called are graphical or visual representation of information. It’s an efficient means to present complex information or knowledge in a simple and clear way without any complications. All through the years, this serves as an excellent means for computer scientists, statisticians and different technicians to develop and deliver different concepts using certain symbols that have specific meanings in different processes. These symbols serve as descriptions for certain concepts or processes and hence are helpful in representing information.
Today, you can see information graphics in each every aspect of life including scientific and pedestrian styles. The information or any text in visual form through text or symbols reaches people fast. And, it is one of the best forms to attract large number of people inn quick time. Different styles, icons, symbols, special texts and much more are best means to communicate with people. Also, to attract vast audience using infographics is essential. In web pages, you need to make sure you have visually catchy content and representations to create a lasting impact in people about the information you wish to present.
There are a number of tools available to create quite attractive and well informative infographics. Take a quick look into some of the best 10 free tools for your guidance.
Stat Planet
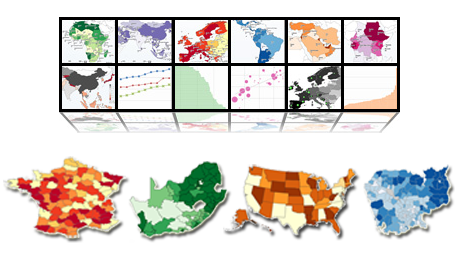
Stat Planet is an excellent tool for creating interactive visualizations that can be easily customized. You can include interactive graphs and charts and make it more visually impressive. You can use the visualization as you get or have it as a static image. You can download it for free or use it within your browser for developing any number of representations. It has a number of map based features that can be used for better interactivity and more precise visual concept for any kind of complex information and concept. Bar charts, time series and scatter plots can be easily animated for more interactivity.
Hohli
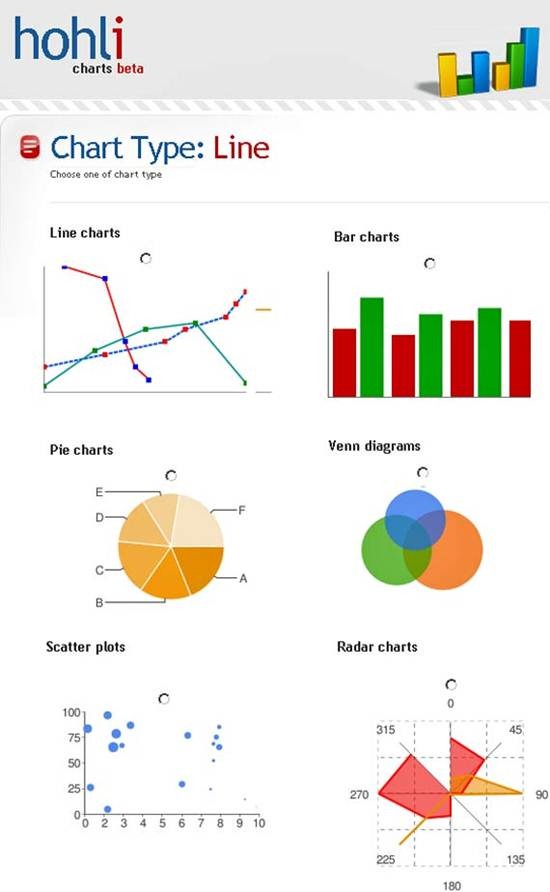
Hohli is a simple and easy to use chart maker for creating Venn diagrams, scatter plots and all kinds of chart based upon information that is entered. It has options for title, changing background graphics and select data points. When presenting information or describing any process, this works well. Also, this is efficient for different comparisons. You need to just select the chart type and data and vary the size and colour of the chart. The output looks awesome as you have enough options to change the colour, size and style.
Creately

Creately is a web based diagrammatic tool for creating diagrams and flow charts. You can use the free trial option to try creating professional infographics. Flow charts, Venn diagrams, story boards, network diagrams, charts and sitemaps can be created using professional colour schemes. Google image search is integrated into this and hence you need not search for images. All important icons for social media and other symbols are also integrated into it. Diagrams and different shapes can be generated in just a click.
New York Times
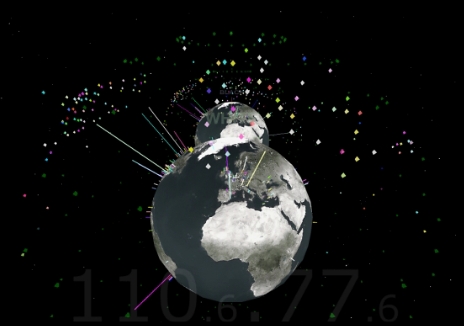
The Visualization Lab of New York Times allows you to make use of statistics from the latest articles or creating different visualizations. You can look into how other people use different concepts and visualizations and hence can get an idea of how to implement your concepts in an interactive manner. Network diagrams, matrix charts, scatter plots and other diagrams can be created using several options that allow easy to use representations.
Many Eyes
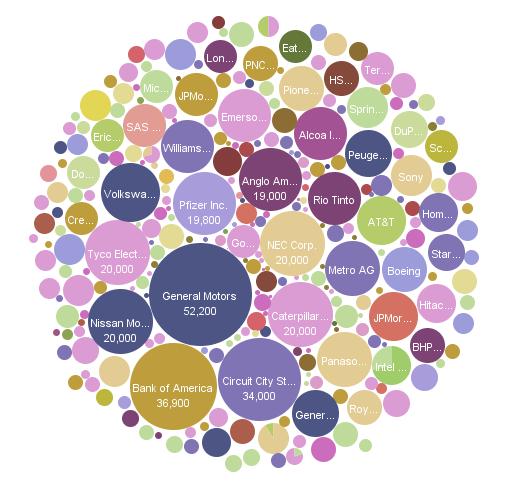
Many Eyes is such an awesome means for visualizations as you can upload data or use existing data in the site. The visualizations are of good designs and have professional look giving you the ease to use data for online visualizations.
Google Public Data
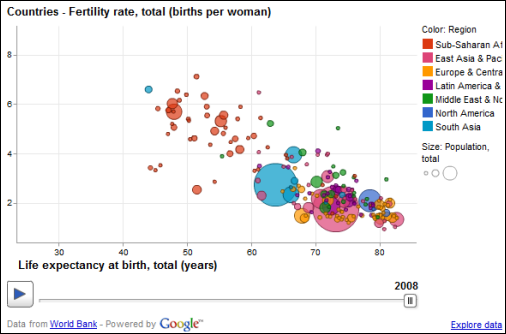
Google Public Data explorer enables using public information in your infographics. Google has lots of public data and stuff for users to apply them in creating visual representations. As you have lots of data, you can compare different sets in a much better way and use them in your graphics. This service is quite excellent as you can generate output much easily with all required data.
Wordle
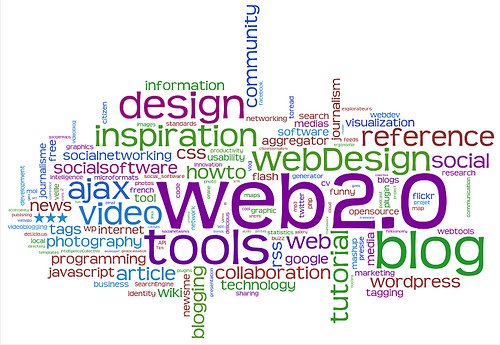
Wordle is an exceptional tool for creating word visualization for any word that you enter. It is pretty interesting to choose different designs for generating world clouds that eventually turns out to be best infographics. You can play with words and make colourful designs to represent concepts in a visually attractive manner. You have a number of designs to choose and hence this proves to be much effective and interactive.
Visual.ly

Visual.ly is an excellent tool for creating visually impressive representation of information. Although it is new, it has thousands of infographics already entered into it. You have three components including search engine for web based infographics, public data store and web based platform for creating any number of infographics.
Inkscape
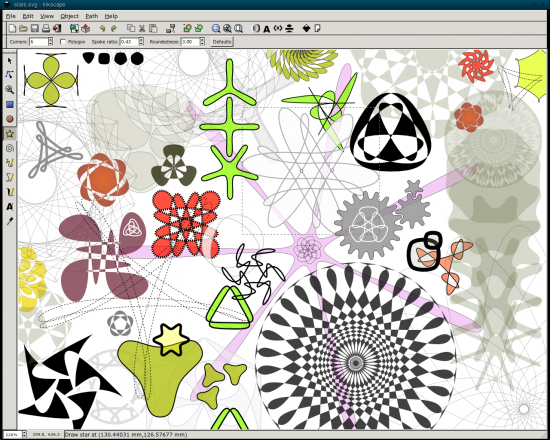
Inkscape is a free vector tool for creating infographics completely for free and is highly interactive. It is an open source vector graphic editor used by many people and is similar in features to CorelDraw, Illustrator and Xara X.
ChartsBin
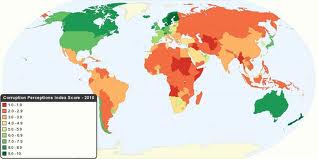
ChartsBin is an awesome tool for creating your own interactive maps in a much easier way with a number of features. You just need to register and you have a number of inbuilt features that you can choose to create maps. You have text, colours, styles and different graphics to interpret in your map.
So, it is clear that timelines, flow charts, annotated maps, graphs, Venn diagrams, size comparisons and different maps serve as best means to deliver information. When creating infographics, planning and research are more important and hence you need to explore more on the tools and their usage. You can use different tools and software to visualize data and represent it in a better form to present information in an interactive way. Hope this article on the free tools for creating infographics would have been helpful to you. Look into the features and try implementing these tools when creating infographics.
This article is written by Debarshi Ghosh Dastidar. He is a part time blogger and a self taught web designer. When he is not blogging he can be found designing premium MagentoFashionThemes. He also promotes 66Themes for cart66 in his spare times.




Nice tools.
check out http://www.infogr.am, it’s a web based infographic creator